As a trader, I have been constantly searching for the tools that would help me take my trading to the next level. TradingView is definitely one of them. So here is my free TradingView Beginner’s Guide. At the end of this post, you can download it for free as a Complete TradingView Handbook pdf.
TradingView is not only a charting platform, you can trade directly from the interface, you can interact with thousands of traders, get trade ideas, run screeners. You name it, TradingView has it.
I’m sure that as a trader, getting the most out of your trading platform is essential. However, there are tons of available websites, screeners, software, and choosing the best option can be really time consuming.

In this TradingView Beginner’s Guide, I’m going to explain to you why TradingView is the ultimate trading companion, the platform that will literally enhance your trading and help you get better results.
If you’re not already a trader, I have a complete Guide to Start Trading and you can also try some of the Top Day Trading books.
What is TradingView?
Let’s start with a quick overview.
TradingView is an online trading and charting platform that also acts as a social network. It is in fact an advanced financial visualization platform.
Launched in 2011, the company is based in Westerville Ohio, USA.
Purely web-based, it is one of the most versatile and powerful platforms out there. If you want to take your trading to another level, you need a tool that gives you professional charting capabilities.
It can be used to trade, chart, and analyze stocks, forex, indexes, cryptos, … mostly any kind of tradeable asset.
I have been using it for a number of years, it is the platform I constantly use to check my holding and trading alerts, on any device (my iPhone, tablet or laptop).
TradingView has really elevated the standard in terms of trading and charting platforms.
It is highly customizable and the charting experience is smooth and very responsive. The charts work on any operating system (iOS, Android, Windows and Linux), and on any device (iPads, phones).
Why Should you Use TradingView?
A hugely successful platform
TradingView’s success has been staggering, with now more than 50 million investors visiting per month, more than 10 million trading ideas and custom scripts published.
According to Similarweb.com, TradingView is the world’s 5th most visited website in the Finance domain, getting 200M visits a month.

According to Alexa, it is even in the world’s top 500 websites, and that’s higher than CNBC, Wall Street Journal, MarketWatch, Reuters, The Economist, Motley Fool, Investopedia, TechCrunch and a score of other websites.
TradingView has versions of its website in 18 languages, among which Russian, Chinese, Spanish, Portuguese, Turkish,…
The whole idea behind TradingView is that on top of being a charting platform it doubles as a trading social network. It is in fact THE largest and most active social network for traders and investors.

Not only can you share your trading ideas with others, but you can also learn from the best traders and improve your game.
You will be able to chat with other traders, see their trade setups, exchange views, join discussions and follow the best among them.
This is how TradingView’s popularity is evolving on Google Trends.
The community is huge and keeps growing, you can talk to millions of traders, users are ranked and so you can jump straight to the most followed traders and start learning from them, seeing their trades unfold. Needless to say that feature alone can be a game changer for your trading.

The most versatile platform
If you compare TradingView with other competing platforms such as Tradestation, TD Ameritrade or Robinhood, no other platform gives you that level of integration. It provides you with cutting edge tech, available on any device, any OS and anywhere.
Actually, a lot of traders use it as a complement to their broker’s trading platform (this is what I do). It is just so easy to access, on all my devices, in a matter in seconds.
TradingView has hundreds of features, for following your trades, getting trade ideas, setting up alerts, all in a few clicks. I have truly never come across such a powerful tool.
TradingView has a free option, but if you start using it regularly you will want to move to a Pro account, as it unlocks the full power of the tool. They have an interesting free trial if you want to give it a go.
A great technology: HTML5, flexible and multi-platform
The technology behind TradingView is really what makes it so user-friendly, fast and responsive. It’s called HTML5.

It enables you to chart and use graphs with the flexibility of a desktop app, all in a web browser, making it ultra fast to launch and highly responsive to use.
TradingView also offers developers an API enabling them to embed graphs on their websites in a powerful and easy to integrate way.
How to open an account in TradingView?
If you want to open a free account in TradingView, just follow this link and click the “join for free” box on the top right hand of the screen.

Then all you need to do is enter your signup details, and you’re ready to go in a matter of seconds !
The free account in TradingView gives you the following features:
- Access to charts and all indicators
- Coverage of most world markets
- 12 customizable chart types
- Server side alert
- 100+ pre-built technical indicators
- 100,000+ community-built indicators
- 50+ smart drawing tools
- Watchlist
- Volume Profile indicators
- Great versatile Screeners
- Backtesting for your strategies
- Timeframes: Daily, Weekly, Monthly
The free account comes with some occasional ads, which is acceptable if you’re not a heavy user. But don’t forget that your free trial has a one month validity.
You might be perfectly happy with the above functionalities. However soon enough you will probably want to do away with the ads and unlock the Pro features. This is what I did, I now have a Pro account with all the extra features.
This TradingView Beginner’s Guide is also here to show you the main functionalities around the platform.
TradingView’s Windows and Toolbars: main functionalities
If you’re starting out in TradingView, you might be confused by the main window and the overall layout. Too many menus, icons, options,…
So let me help you out, and walk you through the main areas and columns, identified below in five separate zones (A to E):
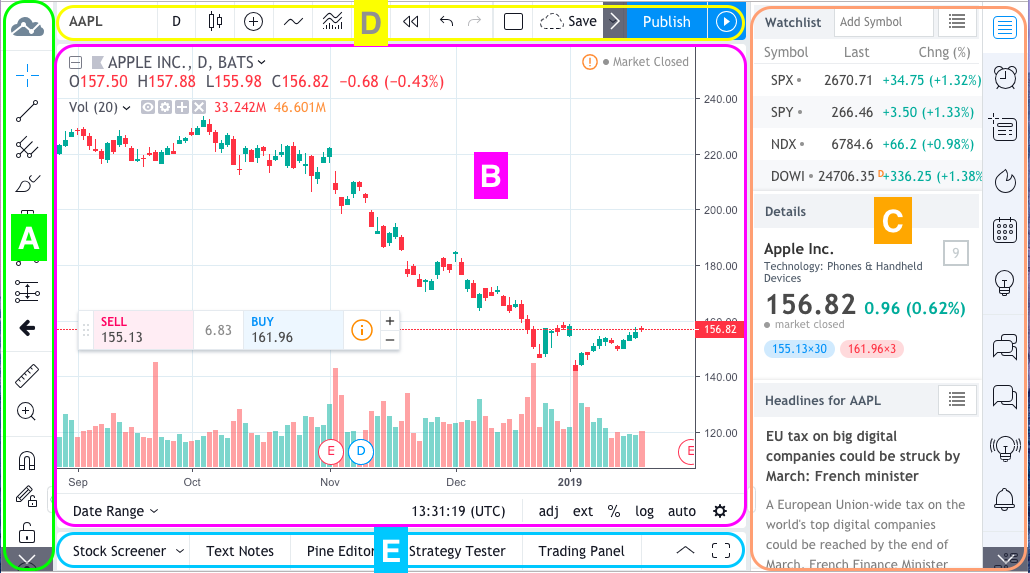
I will now briefly explain these icons and functions.
Left Toolbar (Zone A) : drawing tools
In this area you will find some important tools, such as the settings for cursors, rulers, text zones, arrows, Fibonacci or Gann extensions or retracements, basically everything you want to add on top of a chart once the graph and indicators are set.
The toolbar has 16 buttons or functions :

1. Profile
The first button on the top will link to your profile and profile settings, the ideas you published, the people you follow. You can also leave the chart screen and access a list of ideas published by traders. This is also where you access the Help Center.
2. Cursors
Then come the choice of cursors you want to use. Choose between crosshair, dot, arrow, or the eraser if you want to delete something you’ve inserted on the chart.
3. Trend line tools
The third button is one I use a lot, you can use it to draw trend lines or horizontal lines such as support and resistances. Alternatively, you can draw arrows, parallel channels, flat tops or bottoms, regression trends and a host of other lines and extensions .
4. Gann, Fibonacci and Pitchfork tools
With these tools, draw Pitchforks, Schiff Pitchforks, Gann boxes, Gann squares, Gann Fans, Fibonacci retracements or extensions and many other options. You can even draw Fib circles, Fib spirals, even Fib Speed resistance arcs.
5. Brush and Geometric shapes
With this button, you can pick the brush or insert different shapes (rectangles, ellipse, triangle) but also some more complex shapes (polylines, curves, double curves, arcs).
6. Annotation tools
Adding text on your chart is useful, you might want to add notes or comments around your trades or positions.
Callouts and price labels are also available. If you want the text to remain static when you scroll on the chart then select the “anchored” options.
This is also where you can find Arrow Markers and Flags, very useful to point at specific chart elements, or indicate a trade entry or exit.
7. Patterns
Patterns are usually linked to some specific trading strategies, such as Elliott Waves, ABCD patterns, Heads and Shoulder patterns, Triangles or even Three Drives patterns. The full power of TradingView is evident here with these elaborate drawing tools.
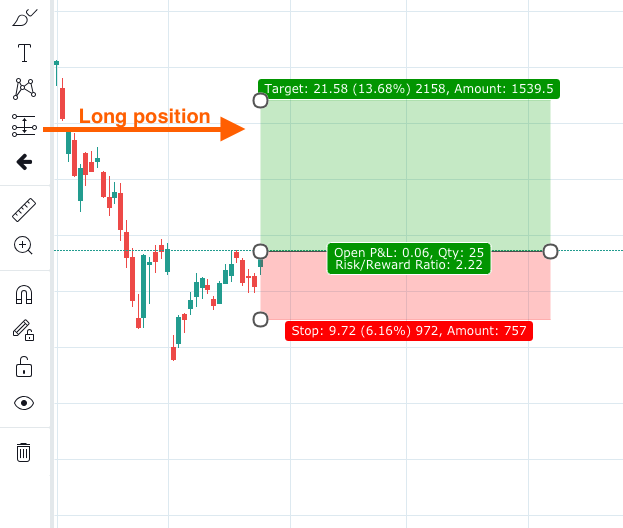
8. Prediction and Measurement
These tools are among the most useful in TradingView. Monitoring Long or Short positions is fantastic, especially if you want to share them with other traders, with direct visual identification of stop losses, take profits or R:R ratios (risk : reward).
Here is what a Long Position looks like :
In this menu, you can also follow date or price ranges, or even map out projections. the Date Range or Price Range tools are also really useful to monitor your trading or measure specific price evolutions.
For social trading these are some of the most useful tools as they provide fantastic visual aids to explain strategies and see how they perform. I haven’t seen them on any other platform.
TradingView have also added the Ghost Feed and Bars Pattern.
9. Icons
Hundreds of icons or pictograms can be inserted on your charts, check out this huge catalog. Another great feature to make your charts more lively and clear.
10. Measure
Next comes the measuring ruler, it will help you measure price ranges in terms of percentage, bars or absolute value. All you need to do is press SHIFT + click on the chart.
11. Zoom In
Zoom In or Out from a specific point on the chart.
12. Magnet
Clicking on this icon will put you in Magnet Mode. It will help you snap the anchors of some chart elements to the highs, lows, open or close of the nearest candles. There’s two options : weak magnet or strong magnet.
13. Stay in drawing mode
This button keeps you in drawing mode. So if you’ve just used a drawing tool you won’t have to select it again in the sidebar to use it again.
14. Lock all drawing tools
Afraid of losing or moving some of your drawings or tools, clicking here will lock their position on the chart.
15. Hide/Show drawing tools
One click and you can hide your drawings and text on the chart.
16. Remove tools or indicators
This is quite straightforward, a quick and easy way to either remove drawings, indicators, or both.
The object tree
A convenient function is the Object tree. Just right click on the chart, pick “Object Tree” and this pops up a very convenient table on the right containing everything on your chart (indicators, drawings, …) allowing you to toggle their visibility, settings or remove them individually.
Main window (Zone B) : the chart area
This is where your graphs will appear, along with the indicators you decide to add.
You can customize the entire chart layout, the colors, etc…
To customize the appearance of your chart, right-click and the below menu will appear.
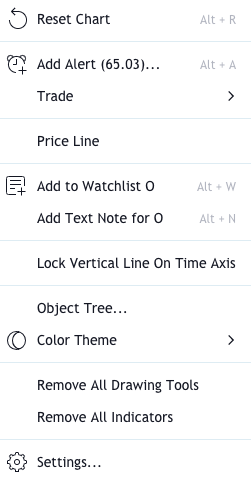
In this menu, you can reset your chart, add a price alert, enter a trade (if you are connected to your broker).
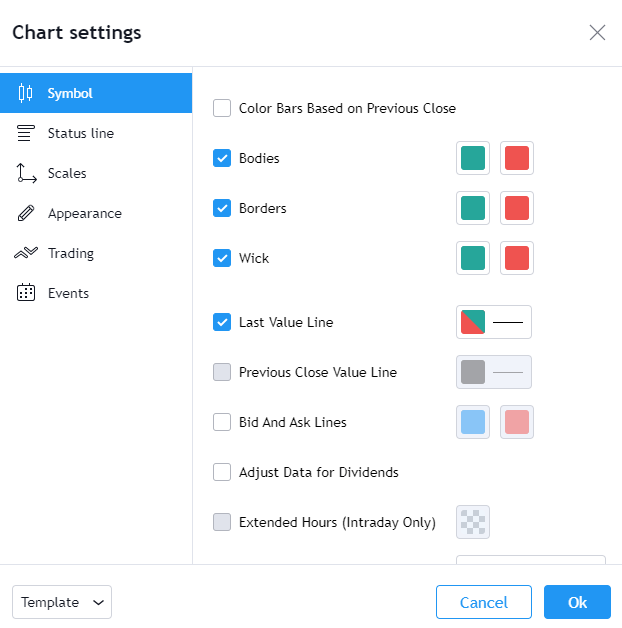
You can also decide to change the settings of your graph. for that, selects “Settings”. You will have scores of options to customize the appearance of your chart (symbol appearance, scales, status lines).
I recommend you take a look at the Events functionality a great way to add Dividends, Stock splits or Earnings announcement directly on your chart. Fantastic when you want to track the impact of such news events on the price action.
Spend some time customizing your graphs, it’s really worth creating your own visualizations.
Right toolbar (Zone C) : watchlists and social trading
In this area, you can search and select all the currency pairs, stocks, indexes or cryptos that you want to follow. This is also where you will setup your watchlists, as well as some really useful tools such as push alerts, economic calendars and all the social tools available in TradingView.
Let’s take a look at the buttons in the toolbar:
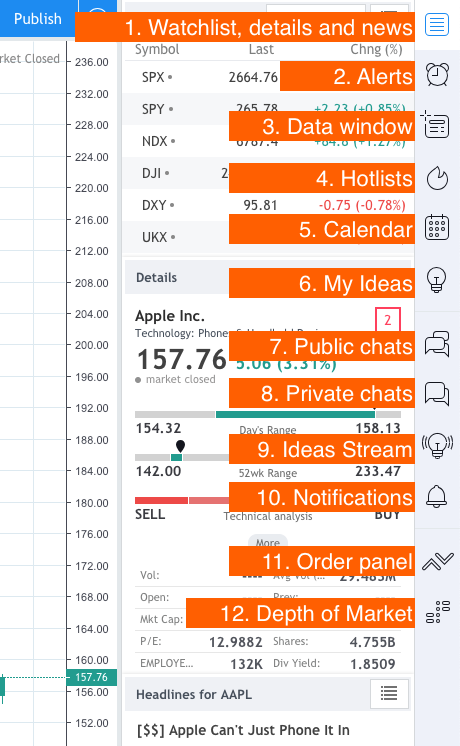
1. Watchlist, details and news
Watchlists are managed in the right column. This is probably one of the most useful features, allowing you to create different lists for different situations. For example you could have one watchlist with open trades and one with potential setups.
Note however that you can only have one watchlist with a free account but an unlimited number as soon as you go Pro.
To add a symbol to a watchlist, type its name in the Add Symbol box and don’t forget to select the nature of that symbol on the top of the search results box, otherwise TradingView could be unable to find it.

Below the watchlist, you will see the Details box, containing useful info on the security you’ve selected, the sector it belongs to, company logo,…
And below the Details box, you can access the latest headlines for the selected security. You can select the news sources by clicking on the little arrow next to the title.
2. Alerts
This button will open a window with all your past and present alerts. Alerts are notifications that are sent to you when a number of conditions are met. They are entirely customizable, see further below how to create an alert in Tradingview.
3. Data window
Provides you with precise data concerning the symbol on your chart. OHLC values (Open High Low Close), percentage change, volume and volume MA.
4. Hotlist
Hotlists contain the main movers on the markets : volume gainers, highest percentage change, … That’s a useful place to spot « values in play » as I call them.
5. Calendar
A chronological account of all the economic news and announcements with actual data versus forecasted and prior releases. Significant deviations are some of the most powerful sources of volatility on the Forex market for example.
6. My ideas
A list of the ideas you’ve published. To add an idea, just click the + button, it can be an analysis or a tutorial. you can of course include graphs, and add tags and category.
7. Public chats
List of all ideas being posted on a given market or topic. Just select the talk you want to follow at the bottom of the screen (for example « Gold discussion ») and the ideas in that discussion will show up on on the top of the window.
8. Private chats
Follow your private messages here. These will only be visible to you.
9. Ideas stream
This stream will show all ideas being published, you have the option to show only the ideas published by people you follow.
If you know who to follow, this can be a great way to find trade ideas. But finding the right traders to follow is the trick. Start by searching for the most popular profiles, you can find them from TradingView’s homepage.
10. Notifications
You will be notified when you have new followers, when you are mentioned in an idea or chat, or when someone comments or likes one of your ideas. All these notifications will be shown here.
11. Order panel
If you are connected to your broker via TradingView, this is where you will find your order entry parameters. TradingView constantly expands on the number of connected brokers, currently some leading industry names are fully integrated (FXCM, Oanda, Tradestation, forex.com, Saxo, WH Selfinvest or CQG).
12. Depth of Market (DOM)
If your broker is CQG and you’re connected to TradingView, DOM enables you to see the order levels for Buy and Sell at specific price levels. Some traders are capable of scalping the market using what is otherwise called “the order book”.
Top Toolbar (Zone D) : timeframes, chart type and layouts
The top toolbar is where you select the timeframe for your charts, add indicators, set alerts and save layout templates. You can also select what type of chart you want.
Let’s take a look a the main buttons :

1. Symbol
This box will contain the symbol of the asset you are looking at. For example, AAPL if you’re looking at Apple Stock. To search for a specific symbol, simply type it in the box and don’t forget to select the symbol type (stock, forex, index, crypto, …).
2. Timeframes
Selecting the timeframe for your chart is easy, TradingView will give you a large list of options, from 1 second to 1 month, or range options.
3. Chart Type
There are many options to choose from when it comes to chart types. When you click on the icon with the candlesticks, the below menu will give you all the available options.
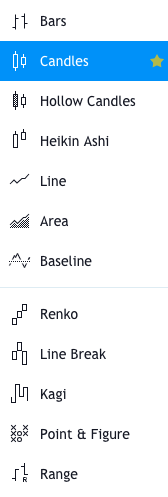
You can now decide to go for bar charts, line charts, candlesticks, Renko, Heikin Ashi, Point & Figure, Kagi, Range charts,…. , that’s the power of TradingView!
4. Compare
This button allows you to add a second asset on the chart, to enable comparisons. For example, you can add the SPY index if you’re looking at US Stocks, it will allow you to compare your stock’s evolution to the broader index. Other available indexes are Dow 30, Nasdaq 100, Nikkei 225, FTSE 100 or Dax. Alternatively, you can pick any symbol.
5. Indicators
This is obviously one of the most important buttons. There are so many indicators you can choose from in TradingView. To insert an indicator, click on the below logo.
If you click on the arrow you will have a list of the most popular indicators, but if you click on the button you will have a choice of indicators in 6 categories.
- Favorites: by ticking the little star next to any indicator, it will appear in your favorites
- Built-ins: all the 100+ indicators that come as standard in TradingView
- Candlestick Patterns : a great new functionality providing pre-programed well-known patterns (Engulfing, Hammers, Haramis, Dojis, Shooting Stars), very very useful.
- Public Library: indicators created by users and made available in the public library, sorted by number of likes which gives an indication of the more popular ones.
- My Scripts: indicators you will have created using the Pine Editor.
- Volume Profile: you need a Pro account to access this indicator that gives you the most traded prices for a particular time period. It is quite a fantastic tool, and this is how your chart will look like.

Financials
TradingView have added this fantastic ability to embed financials below the graph. Just click on the button to get a list of dozens of financial indicators, so that you can monitor the evolution of price alongside the financial aggregate.
6. Templates
Predefined indicator templates, for a specific trading strategy or methodology, such as Bill williams’ 3 lines, ..
7. Alert
Alerts are very useful to warn you that specific price levels have been reached (or crossed). Let me explain how to create a new alert.
Creating an alert in TradingView
To create an Alert, click on the icon, the below box opens up:
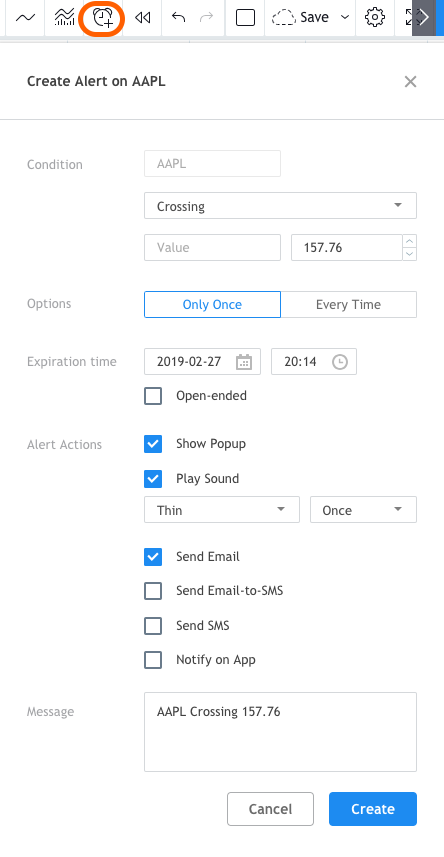
You first have to decide the condition for the alert to be triggered. For example, AAPL stock to cross the 141$ price level.
Then you decide on the validity of the alert (once or every time), and you can set when it expires.
Finally, you have to decide what the alert will trigger: a popup, a sound, an email or an SMS, you have multiple choices. To validate, click Create.
8. Replay
The Bar Replay function allows you to replay a particular sequence of price evolutions, with an adjustable speed parameter. This can help you test your trading strategies by watching the historical evolution of prices.
To use it, just click on the “Jump to” icon, and adjust the red bar on the chart as your start point. Then launch play and adjust the speed.
9. Undo Redo
As you know them.
10. Layout
This menu will allow you to select the number of charts you wish to have on your layout. Multiple chart layouts however are only available to Pro users.
Multiple layouts are useful when you need different timeframes side by side or if you want to track multiple markets.
At the bottom of the same window, you can also define what elements you would like to sync across all charts.
11. Save
The settings wheel will open a window containing all the main settings:
- Style: candle colors, labels on display, you can also activate the sleek Dark Theme
- Scales: multiple options are available for left and right scales
- Background: color, grid lines, symbol and indicator descriptions and values
- Timezone: set your timezone, you can also conveniently choose to show extended hours on intraday charts
- Trading: set what elements you would like to see on your graph once you’re in a trade (open positions, orders, …), you can even decide to play a sound when your order is executed
- Events & alerts: events such as dividend payments, earnings reports or general economic events can be displayed on your graph. This is really useful to correlate events with their potential impact on price
12. Chart properties
This button opens up a window to fully customize you chart (symbol, status line, scales, appearance, trading) or even add events.
13. Fullscreen
This convenient feature will create a dedicated URL of your chart if you want to share it, alternatively you can decide to save an image on your hard drive, or even tweet the image.
14. Snapshot
Hitting the snapshot button will enable you to either create a link to your chart, download the file or tweet it.
15. Publish
Last but not least, the Publish function is at the core of TradingView’s social network functionality. Clicking on it will enable you to either get a link to your image or save your entire chart as an image. You can even choose to Tweet straight from the dialog box, very convenient to share your ideas in a matter of seconds.
Publishing an idea on TradingView
Retail traders rarely have an opportunity to exchange views. They have Twitter, Stocktwits, message boards, but that is usually scattered. TradingView brings all that in one place.
Stan Bokov the co-founder of TradingView calls it “Bloomberg for regular folks”, a reference to the expensive real-time Bloomberg terminals used by Pros in trading rooms at banks or hedge funds.
To access the social network functionalities, you will need an identity and a public record. Everyone gets a profile page, with every idea you’ve ever published. For each trader, TradingView will deliver Reputation scores, rankings, social activity, followers or personal info.
Tu publish a chart and idea in the public gallery, just hit the Publish button.

The following box will open
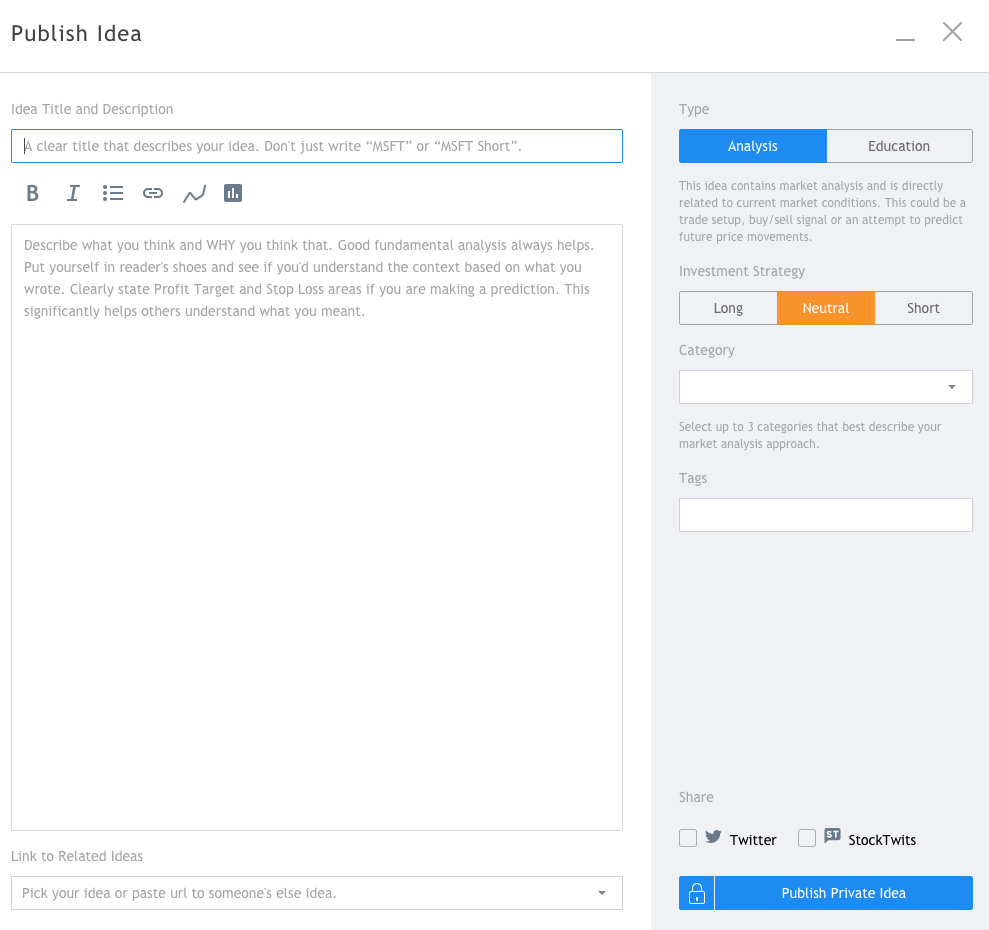
Now all you need to do is write a title for your idea (for example « Going Long on EURUSD at 1.14 ») and in the description box describe what you think and WHY you think that.
On the top right, select if your idea is an analysis or educative, select whether your bias is Long, Neutral or Short, and you also have the option to define a category and some tags to make your idea searchable.
Your idea can also be shared on Twitter and Stocktwits, just tick the corresponding boxes.
People will have the option to like or comment on your idea.
This is just a fantastic way to test your reasoning, break the isolation and confront your thinking to millions of other traders.
There is also a video publishing function if you use Chrome or Firefox.
Once you’ve published, other traders will be able to see, like or comment on your chart and idea.
They can also decide to Follow you to get systematic access to all the ideas you will publish.
There are Public Chats and Private Chats, and these can be accessed on the far right column.
The sharing aspects behind TradingView are what makes it so unique. You will not find a single other platform with such reach and breadth, giving you the ability to share your trades, understand what went right or wrong, and keep learning and improving.
TradingView is literally breaking the Trader’s isolation.
Bottom toolbar (Zone E) : screener, tester and broker area
The bottom toolbar is where you can run a screener, take some notes, code your own indicators with the Pine Editor, launch a Strategy Tester or connect to your broker.
The first tab is the screener, let’s take a more in depth look.
How to use the TradingView screener?
The screener is available for stocks, forex or cryptos. It will look like this :

First, you need to decide which Dimension (1) you are going to use to screen your stocks (overview, performance, valuation,…). Then you have to select a timeframe (2), and the market you wish to analyze (3). Finally, you have the option to apply elaborate filters (4), allowing you to select multiple criteria, as shown below.

Once you have list selected, you can download it by clicking on the arrow just left of the timeframe button.
If you want to test the screener, I have a video and an article on How to Find Trending Cryptos with TradingView Crypto Screener.
Text Notes
I guess that’s pretty self explanatory. This function allows you to take notes, it can act as your trading notebook.
Pine Editor : programming your own indicator or strategy
The Pine Editor enables you to script your own indicators. There’s an entire Pine Script tutorial in TradingView’s wiki here.
Strategy Tester
In order to test a strategy that you have defined in “Indicators & Strategies” or programmed in “Pine Editor”, you should apply it to the chart.
Trading Panel
Depending on where you live, you might be able to connect your broker to your TradingView account.
The available brokers are the following :

Connecting your broker can have immense benefits, you will add TradingView’s huge capabilities to the existing services provided by your broker.
TradingView keeps adding new brokers, currently they offer integration with some leading names (not exhaustive):
- TradeStation
- FXCM
- Capital.com
- Skilling
- Forex.com
- CQG
- Saxo
Another option is “Paper Trading”, equivalent to a demo account in TradingView.
Types of Accounts and Pricing
There are four types of accounts in TradingView: Free – Essential – Plus and Premium.
The pricing ranges from free to $49.95 per month, and below are the respective features.

Personally, I have tried and used Plus for a long time. It comes with no ads, 4 charts per layout, at least 10 indicators per chart, unlimited templates and watchlists.
This is perfect for my trading needs and the yearly cost is covered with a few well executed trades only.
Cool New Features: Video Comments and Lightweight Charts 2.0
TradingView has recently added cool new features such as Lightweights Charts 2.0 and Video Comments.

Lightweight charts include a lot of enhancements such as pixel perfect rendering, improvements in time scale, API enhancements.
Pixel perfect rendering ensures that graphs are always in their highest resolution, at any screen resolution or browser zoom.
Timescales now enable you to zoom until you only have two bars on the screen. there’s also a new option to display series’ last price line.

Another great feature is Video Ideas. To enhance the social networking features of the platform, Tradingview has now included the possibility to record videos on the platform and use them as comments. These videos can upload straight to your Youtube account which is a pretty amazing feature.
Videos can be up to 20 minutes long and all you need to do is tick the Youtube box in the idea sharing dialog box.
TradingView’s Mobile app (iOS or Android)
The TradingView mobile app is available for iOS in the App Store (since April 2017) and for Android in the Google Store.
On iOS it is available in two versions, iPhone or iPad. Its review profile is excellent and you can use it in conjunction with a free account to get the basic functionalities.

CONCLUSION
TradingView is by far the best charting platform around. Millions of traders have adopted it. Its ease of use, fluidity and endless functionalities are matched by none.
If you add the social networking capabilities, you are left with a tool that can significantly help you progress in your trading journey.
I’ve now come to the end of this Beginner’s Guide, I hope you find it useful. The platform has much more to offer than what I’ve described here.
Stan Bokov, the co-founder of TradingView, says traders and investors face two major struggles:
First, avoiding the isolation, then getting legitimate guidance.
TradingView has clearly been created with both these objectives in mind.
If there are things that you like, dislike or are curious about don’t hesitate to leave a message below.
I hope this review will be helpful. If you want to thank me, buy me a coffee 😉
Disclaimer: this review contains affiliate links to TradingView, if you click and subscribe to the service, I will earn a small commission from TradingView. This helps me cover the costs of this website. Finally, I never review or recommend products that I have neither tested nor thoroughly appreciate.
Download this post as a Complete TradingView Handbook (PDF)
This entire post is available as a PDF document for free, here you can download the Complete TradingView Handbook PDF, and I’m not collecting your email.
If you want to thank, me you can buy me a coffee here.
I do not collect your email and will not spam you with unsolicited content.
Further Reading
- How to Trade the OWL System from Gil Morales and Chris Kacher (A step-by-step guide)
- Larry Connor’s 2-period RSI Strategy
- What is a Gamma Squeeze in the Stock Market?
- Unboxing Success: A Comprehensive Guide to Trading with the Nicolas Darvas Box Method
- Koinly, the Top Crypto Tax Software: make taxes easy!
All I want to know is when are is TV going to fix the egregiously stupid and opaque layouts tool.
A nice start would be the ability to even see what symbols are associated with which layout.
As it stands, it’s a joke.
Hey Tarek, the colors are the importance of the news event (yellow = low, orange = normal, red = high) and the numbers relate to the news event in itself. For example a Consumer Price Index will read at 1.5. You will see the highest volatility in the forex pairs affected by Red events where the reading comes out significantly different from the forecast.
I hope that helps.
Hey,
Thanks for the great post! I’m trying to understand how to read these “news forecast” as shown in this picture:
https://i.imgur.com/1KZ8h4Y.jpg
Can you help understand what orange and red means? How these numbers affect the pips? Does a forecast of 1.5 mean it might move 1.5 pips?
Thanks Tori, glad you like it
Thanks for the guide! That’s a very good step by step list for all beginners!
If you’re just getting started you can also try one of these tips : http://tradingtools.net/learn…
Agreed, it’s definitely my everyday tool
Tradingview just has this amazing interface and so many tools available, including some trade follow-up tools and I also love the social features
Hey Hamish, thanks a lot for your encouragements, and I hope you find success in your trading journey. Stay tuned !
Hello’ Wow!this is information. From all the information given here if I have the mind to invest in trading, Trading View would be the place for me to go.
I see no way where one could go wrong following your many tips in this post. I take it that the term Beginners Guide means those who are going into trading for the first season and know nothing about trading, like myself.
Cheers!
DorcasW
I use TradingView for Forex Charts. My trading approach is relatively straightforward, and TradingView fits in very nicely with my approach to the markets.
There are some things I love about TradingView and one of them is the fact that I can access my platform from anywhere since it’s browser based. I don’t love schlepping my expensive laptop everywhere I go, so having the charts in the cloud is really helpful.
Whether you’re into active trading or just curious about what the market is doing from time to time, TradingView is an excellent tool to use for researching, charting, and screening. You get a ton of research tools for free right on the home page, and with a basic account, the avid beginner can practice charting and mock trading for free before placing trades at their favorite brokerage.
I had not known anything about the tradingview website until now and I think that this website looks a bit daunting in the amount of options you have to work with when it comes to stocks and anything financial. Why did you choose this website over all of the other trading and financial websites out there?
Hey I found your site very interesting. I had not had any experience of trading before alighting on your pages by accident and I had never seen a site like this, nor was I aware of what it might offer or what to expect from it.
I think you have done a great job on educating me on all of these questions, although I didn’t even have an intention of asking them!
The upshot is that you sparked my interest and I am now definitely going to do more research with a view to coming back to have a look again at your site and comparing what you have to offer against other similair sites
Thanks again for the simplest of explanations that has sent me in a direction I would not previously have envisaged
This is really helpful.
Please, How do I stop subscribing as a Pro Member of Trading View?
You can have a go at the following script:
https://www.tradingview.com/scripts/expiry/
Please I need plot the expiry options of 2020. How I can do it?
regards