
Today, we’re diving deep into the world of technical analysis, a superpower for understanding market movements and making informed trading decisions.
But before we get lost in a maze of fancy lines and squiggles, let’s talk about our secret weapon: TradingView indicators!
If you’re a regular on TradingView, you’ve probably noticed the impressive library of indicators staring back at you. Don’t worry, it’s not meant to overwhelm you!
Think of these indicators like tools in a toolbox.
Each one serves a specific purpose, helping you analyze price movements, identify trends, and gauge market sentiment. The key is understanding which tool to use and when.
Now, buckle up because we’re about to unlock some of the most popular TradingView indicators and how they can elevate your chart-reading game.
Moving Averages: Your Steady Guiding Light
Imagine a smooth line gently following the price action on your chart.
That’s a moving average (MA) in action! It helps smoothen out price fluctuations, revealing the underlying trend. Think of it as a compass for navigating the often choppy waters of the market.
There are different types of moving averages, each with its own personality.
The Simple Moving Average (SMA) is a classic, calculating the average price over a chosen period.
The Exponential Moving Average (EMA) puts more weight on recent prices, making it more responsive to new information.
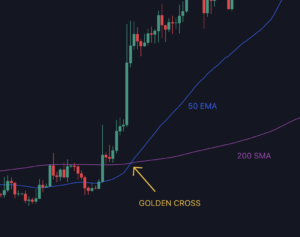
Pro Tip: Use a crossover strategy with moving averages to identify potential entry and exit points. Here’s a simple example:
- Buy signal: When the 50-day EMA crosses above the 200-day SMA (golden cross). This suggests a potential shift towards an uptrend.
- Sell signal: When the 50-day EMA crosses below the 200-day SMA (death cross). This suggests a potential trend reversal towards a downtrend.
Remember: This is a basic strategy, and market conditions can be complex. Always consider other factors like price action confirmation and overall market sentiment before making trading decisions.
Implementing in TradingView
Adding moving averages to your TradingView chart is straightforward. Here’s how:
- Click on the “Indicators” tab on the top of your TradingView chart.
- In the search bar, type “Moving Average” or “MA.”
- Select the type of moving average you want to use (SMA, EMA, etc.).
- Adjust the length of the moving average (e.g., 50-day, 200-day) according to your trading strategy.
- You can add multiple moving averages to your chart by repeating these steps.
The RSI: Unveiling Overbought and Oversold Conditions
Ever feel the market is getting a little frothy or maybe a tad too pessimistic?
The Relative Strength Index (RSI) can help you gauge that.
This oscillator measures the momentum of price movements and indicates when an asset might be overbought (above 70) or oversold (below 30).
Think of the RSI like a mood meter for the market.
A high RSI suggests the market might be due for a pullback, while a low RSI could indicate a potential buying opportunity.
However, the RSI alone shouldn’t be your decision-maker. Use it in conjunction with other indicators and consider overall market trends.
Pro Tip: Combine the RSI with price divergences to identify potential reversal points. Here’s how:
- Look for situations where the price keeps making new highs but the RSI fails to reach new highs (bearish divergence). This could be a sign that the uptrend might be losing momentum.
- Conversely, look for situations where the price makes new lows but the RSI doesn’t reach new lows (bullish divergence). This could be a hint of a potential trend reversal towards an uptrend.
Implementing in TradingView
Adding the RSI to your TradingView chart is just as simple:
- Go to the “Indicators” tab on the top of your chart.
- Search for “RSI” in the search bar.
- Select the RSI indicator from the results.
MACD: The All-Around Powerhouse
The Moving Average Convergence Divergence (MACD) is a three-in-one indicator that can feel intimidating at first, but trust me, it’s worth befriending!
The MACD uses a combination of moving averages to identify trends, momentum, and potential reversal points.
It consists of two lines: the MACD line and the signal line.
When the MACD line crosses above the signal line, it can indicate a bullish signal, and vice versa for a bearish signal. The histogram adds another layer of information, showing the difference between the two moving averages.
Expanding bars suggest increasing momentum, while contracting bars hint at a weakening trend.
Pro Tip: Use the MACD alongside support and resistance levels to refine your entry and exit points. Here’s an example:
- Identify a support level on the chart.
- Wait for the MACD to generate a bullish crossover (MACD line crossing above the signal line) near the support zone.
- This confluence of a support level and a bullish MACD signal could be a good opportunity to enter a long trade (buying).
Remember: Always set stop-loss orders to manage risk, and this is just one example. There are many other ways to use the MACD depending on your trading style.
Implementing in TradingView
Adding the MACD to your TradingView chart is a breeze:
- Navigate to the “Indicators” tab on the top of your chart.
- In the search bar, type “MACD.”
- Select the MACD indicator from the results.
Awesome Oscillator: Your Built-in Momentum Meter
Looking for a quick and easy way to gauge market momentum? Look no further than the Awesome Oscillator! This indicator uses price differences between closing bars to show the momentum behind price movements. Rising bars indicate bullish momentum, while falling bars suggest bearish momentum.
The beauty of the Awesome Oscillator lies in its simplicity. It doesn’t require complex calculations or interpretations. However, keep in mind that like the RSI, it shouldn’t be used in isolation. Combine it with other indicators for a more well-rounded analysis.
Pro Tip: Use the Awesome Oscillator to identify potential trend reversals based on momentum shifts. Here’s how:
- Look for situations where the Awesome Oscillator makes a series of high bars followed by a series of low bars, even though the price action might not necessarily be making new highs or lows. This could be a sign of waning momentum and a potential trend reversal.
Implementing in TradingView
The Awesome Oscillator is readily available on TradingView:
- Go to the “Indicators” tab on the top of your chart.
- Search for “Awesome Oscillator” in the search bar.
- Select the Awesome Oscillator indicator from the results.
Bollinger Bands: Defining Support and Resistance Zones
Imagine a price channel with a moving average in the center and two bands above and below it. That’s what Bollinger Bands do! They statistically calculate standard deviations from the moving average, creating a price channel that expands and contracts based on market volatility.
Bollinger Bands are excellent for identifying support and resistance zones. When prices touch the upper band, it might indicate a potential resistance level. Conversely, reaching the lower band could suggest a support level. However, breakouts above the upper band or breakdowns below the lower band don’t always guarantee a continuation of the move. Be sure to look for confirmation from other indicators or price patterns.
Pro Tip: Combine Bollinger Bands with price action confirmation for better entry and exit points. Here’s an example:
- Identify a narrow Bollinger Band contraction, suggesting low volatility.
- Wait for a price breakout above the upper Bollinger Band.
- If the breakout is accompanied by a surge in volume, this could be a strong signal for a potential uptrend, and you might consider entering a long trade.
Remember: False breakouts can occur, so always manage your risk with stop-loss orders. There are many other ways to use Bollinger Bands depending on your trading style.
Implementing in TradingView
Adding Bollinger Bands to your TradingView chart is straightforward:
- Click on the “Indicators” tab on the top of your chart.
- Search for “Bollinger Bands” in the search bar.
- Select the Bollinger Bands indicator from the results.
Beyond the Basics: Explore the Vast World of TradingView Indicators
This article just scratched the surface of the incredible indicator library offered by TradingView.
If you want to k now more about this amazing platform and its functionalities, head to my Complete TradingView Begginer’s Guide, you can even download free as a pdf here.
There are countless other indicators available, each with its own unique strengths and weaknesses.
As you gain experience and confidence, explore other indicators like Stochastic RSI,…etc.
Further reading
- Unlock Your Trading Potential with Financial Wisdom TV: A Comprehensive Guide to Stock Market Success
- Follow Crypto Traders on Arkham and Profit from Their Trades
- Level Up Your Trading with TradingView Paper Trading
- How to Trade Linda Raschke’s Turtle Soup Strategy (Step-by-Step)
- The Wildest Bitcoin Predictions Made Some Years Ago Now Make Sense