Access the best charting and analysis tools in the market
Disclaimer: some of the links below are affiliate links, meaning, at no additional cost to you, I will earn a commission if you click through and make a purchase
If you’re a day trader using technical analysis, or relying on screeners to pick your trades, you need the best online platform you can find.
Maybe your broker provides you with a good interface, but chances are it doesn’t include all the bells and whistles you might need.
In this article, I’ll tell you about the top 10 free stock charting websites for day traders, they can make a real difference in your trading performance.
Video: the Top 10 Free Stock Chart Websites
1. Tradingview.com
Tradingview is an amazing website, its HTML5 interface is truly one of the best you’ll find.
As a day trader, you get real time charts on the 1min, 3min, 5min and 15min timeframes. The charts are clear, ultra-responsive and there are loads of customizable options.
TradingView also provides you with hundreds of charting tools and indicators, a stock screener, watchlists, and it even integrates social trading capabilities. That means you can share your charts and studies with other traders, and benefit from some useful tips and strategies from the best ranked traders.
TradingView provides a free option which is very complete, but offers more premium options which are ad-free and enable real time data and a good number of upgraded features. The premium options are Pro, Pro+, and Premium.
TradingView also has broker integration, meaning you can trade directly from the charts. And they keep adding brokers. The most recent addition is WHSelfinvest.
I have a very detailed article on TradingView in this article, it is clearly my number one choice.

2. Finviz.com
Getting access to free stock charts is great, but there’s another tool that can really help you in your trading, that’s stock screeners. With screeners, you can enhance your watchlists and narrow down on stocks with very specific characteristics.
Finviz excels with its free Stock Screener, mainly on US stocks. The filter options are amazing, you can screen stocks by literally every available criteria (from detailed financial ratios, technical analysis patterns, etc…).
For example, if you want a simple selection of Stocks that are likely going to be in play on any given day, you can select from the Technical tab :
- Change from Open : up 3%
- Candlestick : Marubozu white
And that’s it, you get a simple selection of daily stocks that you can monitor and try to ride on the uptrend, providing you select th right configurations.
The site also offers some good sectorial heatmaps, giving you the values in play for each sector at a glance.
The free version of Finviz includes more than most users will ever need. But there’s an Elite version that includes a fully ad-free layout on top of a number of additional features:
- real time data (quotes, charts, screening)
- intraday charts
- advanced charting
- technical studies backtest
- fundamental charts
- email alerts
A good thing about Finviz is that the free charts natively include some overlayed technical indicators, which is very useful to get an instant view of a stock’s situation.

3. StockCharts.com
Stockcharts is a hugely successful platform claiming 1.6m users, boasting award winning charting and analysis tools. I’m sure you’ve seen their charts on dozens of websites, news articles, trading books or even seminars.
There’s a free 1-month trial but StockCharts unlocks ist full power to its Members, with 25 indicators per chart, intraday charts, auto-refresh. Membership can get technical alerts that will give them a timely edge over other traders.
Stockcharts has a number of very distinctive features, some of which stand out from other online websites:
- SharpCharts: a unique award-winning bar/candlestick charting program. The main reason people come to Stockcharts.
- PerfCharts: interactive charts that allow you to compare the performance of up to 10 different securities on a percentage variation basis;
- CandleGlance Groups: display up to 12 mini charts displayed side by side, great to get a quick overview of stocks that stand out;
- Seasonality: display a stock’s monthly price performance or trends over a specific time period;
- GalleryView: view charts on multiple time frames side by side, very useful for some trading strategies relying on simultaneous short, medium and long term analysis;
- MarketCarpets: Scan a wide group of stocks and detect trends and technical patterns;
- Relative Rotation Graphs: side by side display of the relative momentum and strength of a stock;
- Dynamic Yield Curve: an interactive chart showing the relationship between securities and interest rates.
Finally, their Charting School is also an excellent starting point for beginners, providing a complete educational portal (ChartSchool), it’s free and very well organized.

4. MarketWatch.com
The free charts on MarketWatch are clear and responsive, though you won’t get intraday charts with the lower timeframes, so day traders beware. Despite that, MarketWatch attracts 19 million unique monthly visitors, it is one of the most visited financial websites around.
The are many options to choose from on MarketWatch’s free graphs, all from easy to manipulate drop down boxes:
- a lot of technical indicators as overlays
- lower charts, ie indicators below the charty
- timeframe and time range
- chart type (line, candlestick,…)
- events (dividends, earnings, splits)
- news density

But Marketwatch is a very complete website, offering much more than free stock charts. It embeds a host of screeners, news feeds, portfolio options, and has a full range of other useful tool for traders and investors. If you register for a free account, you get one of the most comprehensive portfolio tracking tools available on any business website.
Last but not least, MarketWatch integrates Barron’s and the Wall Street Journal news content.
Just take a look at their site content below.

5. Google finance
Google Finance is totally free. The stock charts are clean and very easy to read, they include some useful features such as the ability to overlap other stocks in order to compare their relative evolution. Everything is there, financials, latest infos, related markets, …
News feeds from hundreds of websites are also a plus, Google’s coverage is obviously one of the widest you’ll find.
Google Finance was actually scaled down in November 2017, dropping a few functionalities in the process :
- Portfolios
- News from Google News
- Fundamentals and Company Overviews
- Stock Screener
- Google Domestic Trend
The Google Finance service is now only a tab in the general google bar, it offers a simple and user-friendly service but actually quite bare bones.

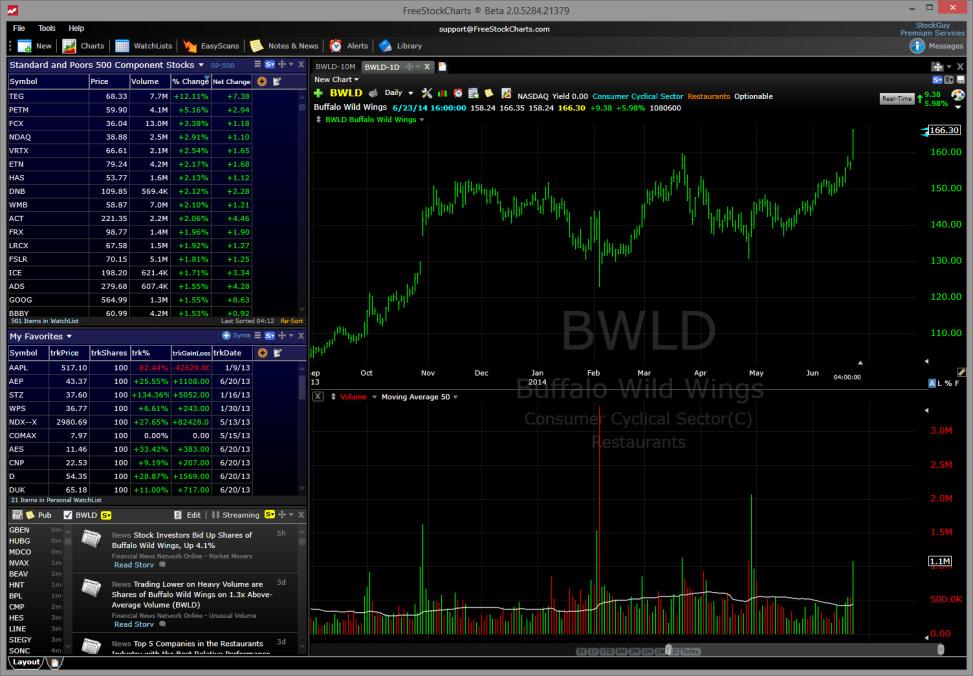
6. Freestockcharts.com
As the name suggests, real-time charts are free on this website, and you can track stocks, ETFs and indexes with a large range of indicators applicable on the charts.
The Freestockcharts interface is not very different from Thinkorswim, and a lot of traders think it’s one of the best free platforms available.
The service runs on Silverlight, a free web-browser plugin by Microsoft. You can check your compatibility here, but basically you’ll need to be on either Internet Explorer or Firefox. It will run perfectly also on a Macbook running Safari.
The free version will include some large ads on the right side, so you might want to use quite a large screen. The premium platform costs $19.99 per month, offering ad-free charts with custom layouts, watchlists, multi-monitor support, scanning and alerts directly from the indicators on the charts. The service also includes sector or industry analysis.
There are tutorials and a PDF available to guide you through the usage of the website.
7. Yahoo finance
It is quite commonly accepted that Yahoo Finance has a better look & feel and depth of functionalities than Google Finance.
The platform goes way back, it was launched in 1994, with a mission to help investors and traders make informed decisions on the financial markets.
Yahoo Finance is a complete portal, offering News, Screeners, Portfolios, Market and Industry insights, even videos and a dedicated team of reporters.
The charting capabilities are excellent, with clear interactive graphics on which technical indicators can be overlayed (a huge list actually). Events such as dividends and stock splits can be included, and you can also add another stock for comparative evolution.
Yahoo Finance really remains one of the leading websites for the investing community, getting close to 180m visits per month.

8. Thinkorswim
Thinkorswim is the renowned platform of TD Ameritrade. It is clearly professional grade. To use it free, you can simply open an account without depositing any money (TD Ameritrade will allow that).
This will give you access to one of the most powerful platforms around, with the possibility to scan, use indicators and get live quotes.
Some cool features include for example « OnDemand », where you can go back in time at any desired date and let the price play out.

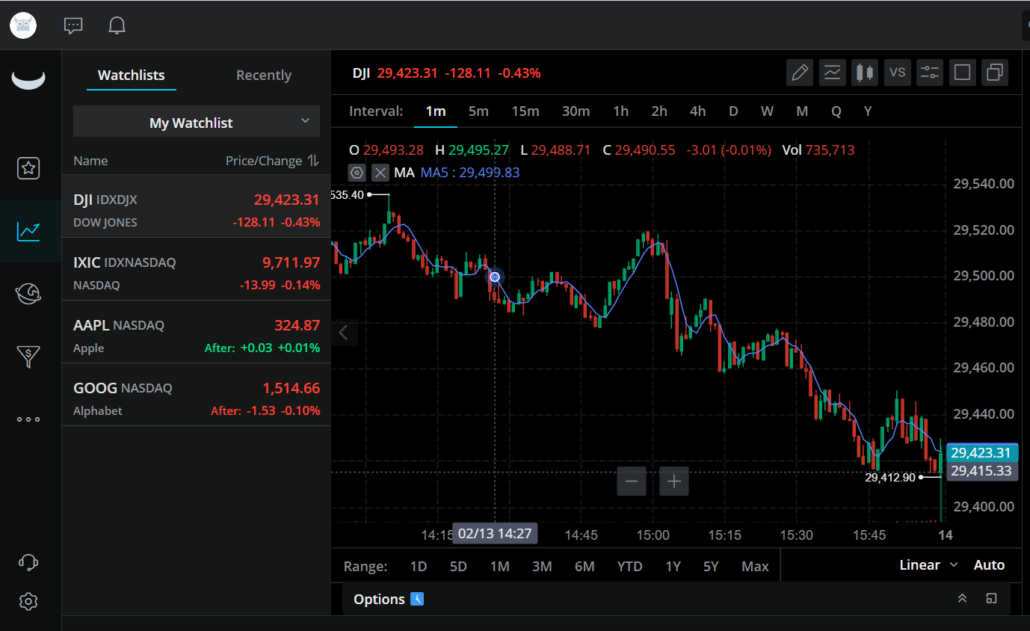
9. Webull
Webull is the latest zero commission broker (on US stocks and ETFs), but they have a fantastic webapp platform I recommend you to look at. They are a US-based Fintech founded in 2017.
Their trading platform is extremely well integrated with their brokerage service, and if you open an account they will give free stocks worth up to $300, so that’s well worth checking out.
Webull is very much oriented towards technical traders and they have in-depth stock market research available daily.
10. Trade Ideas
Trade Ideas is a fantastic scanning tool. It comes with plenty of predefined scanning settings, adapted to most trading contexts or strategies.
Over the built-in scans, you can add your own settings, such as volumes, exchanges, price ranges.
The free version of Trade Ideas requires you to setup an account but then gives you access to a lot of technical indicators. With the premium versions, you can back test your pre-built scans (OddsMaker tool), allowing you to test the efficiency of your strategies.
Some more elaborate tools come with the premium subscriptions, such as Holly (incorporating Artificial Intelligence) which scans thousands of trading opportunities based on multiple sets of criterias (social, technical indicators, or fundamental data).

Final thoughts
When you choose a website for free stock charts, be mindful of the fact that free is not always best, because the data might not be completely real-time.
There’s usually only one provider of free Data, that’s BATS (an electronic exchange processing trades on US equities), meaning you will only see the data coming from transactions executed at this specific provider. So that will be an approximation of all the market movements.
If you pay for official real-time data, you will get Level 1 or Level 2 data that is both accurate and timely, something BATS cannot guarantee. So that’s something to keep in mind.
If however you decide to go with free data, my recommendation is to go with the Top 3 websites, which to me are TradingView, Thinkorswim or Finviz.
Drop us a comment below if you know of any other free website providing free stock chart data.
A PDF version of this article is available for free on my Free PDF download page.
Further Reading
- How to Trade the OWL System from Gil Morales and Chris Kacher (A step-by-step guide)
- Larry Connor’s 2-period RSI Strategy
- What is a Gamma Squeeze in the Stock Market?
- Unboxing Success: A Comprehensive Guide to Trading with the Nicolas Darvas Box Method
- Koinly, the Top Crypto Tax Software: make taxes easy!
I hope this review will be helpful. If you want to thank me, buy me a coffee 😉
Thanks for the list!
We have a new free tool for top-down analysis (very different than most tools in the analysis method).
Perhaps you could add it to your list (we’d also appreciate your feedback!)
Check it out:
TradingLever
https://tradinglever.leverium.com
The secret of success is hard work
Yes, I use Tradingview every day to monitor my trades and follow my portfolios, I’m a big fan of their Screener functionality, really powerful
Yes, you ‘ll find the free option is great at tradingview up to some point only, then the basic subscription opens up a whole new range of opportunities
The most useful is Tradingview, I use it every single day. https://tradingview.go2cloud.o…
Thank you for such great post, I have tried trading before but i did not continue with it, I guess it was not my passion or i lacked the support. Your website will really help a lot people , i know from my experience that i did not continue with it because lack of proper information and tools.
Tell me, how has this tools being working for you?
This list is great. I have used Yahoo finance casually but really appreciate the indepth list of options here for free sites to use for the stock market. The note at the end about the timing of the data was very useful as well if I get more into this I might consider a paid option to get more real time data. Thanks!
I have heard of finviz before but I will probably take a look at the google stocks website. I only trade in dividends if I trade stocks but I am also interested in anything that gives information about crypto. Which of these websites has been most helpful to ya and why do you prefer this website over the others you have mentioned?
Thanks so much for that. I’m glad you find this useful, free stock chart websites are so useful for day traders as a complement to our normal brokers platforms. I see you’ve been struggling with your trading, if you want to strat fresh and take it one step at a time, check out this article on 20 ways to Learn Stock Trading : a Complete Beginners Guide for Investors, I hope it helps. Cheers. John.
Awesome!What an incredible blog post; Thanks for this wonderful enlightment.This is an expensive information that is very hard to comeby on any blog and i must say its an eye opener for me
I am still hopeful i will become a professional trader someday because I really want to trade but each time I open a live account, I normally burn my account to zero which is very discouraging.
Thanks for sharing the free stock chart…. its lovely