This guide may contain affiliate links, please read my disclosure for more info
Whilst your broker might have a great platform, with all the bells and whistles, it might not have all the functionalities available. That’s why you can use Free Stock Chart Websites.
There are a few fantastic free options that are well worth considering to perform your Technical or Fundamental analysis.
These sites include advanced graphics with powerful indicators, position follow-up, screeners or social trading.
Let’s take a look at some available options.
The Best Free Stock Chart websites
I’ve covered the top 10 Free Stock Chart websites in a detailed article, but if you want to shortcut your way, go with one of the following.
Here are the top 3 Stock Charting platforms :
- TradingView.com : the most powerful and flexible to use
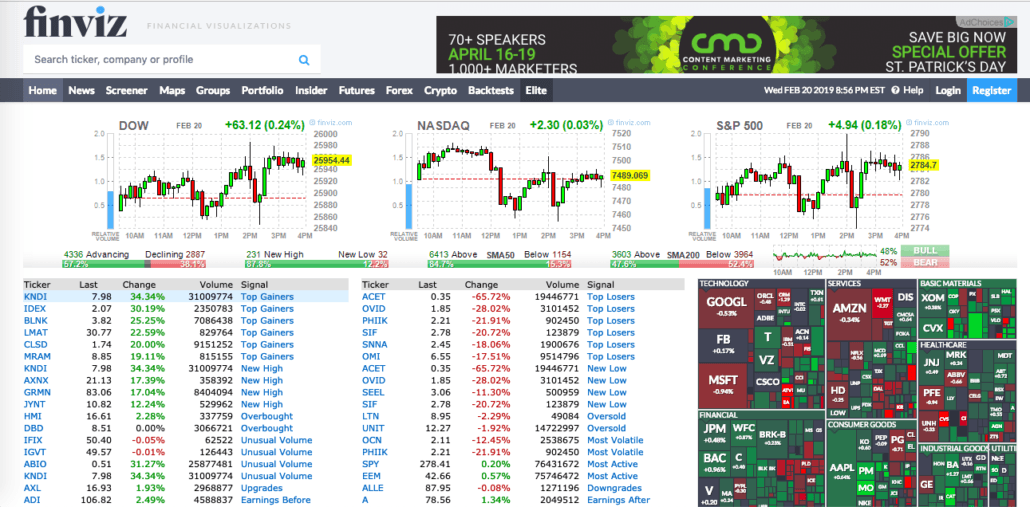
- Finviz.com : for its fantastic screening capabilities
- Stockcharts.com : a timeless reference of so many websites and traders
TradingView, the most versatile and fluid platform out there
- TradingView is an amazing all-in-one platform for all your technical analysis needs. It is the most widely used and certainly the most versatile. Read my complete TradingView Beginner’s Guide.

Pros: TradingView has a clean and powerful HTML5 interface, making it really nice and fluid to use. It has tons of indicators, social trading, and so many powerful features. You can even trade directly from the interface if you have an account with one of the partnering brokers (FXCM, Oanda, Tradestation, Saxo, Forex.com, …).
Cons: pop-ups on the free version. Its also takes a bit of time to learn how to use some of the most advanced tools.
TradingView has four account types: Free – Pro – Pro+ – Premium. The pricing ranges from $9.95 to $39.95 per month. The Free option is great, it provides access to most of the advanced features and offers a fantastic set of tools.
Finviz.com, for its fantastic screening capabilities
- Finviz is well-known for its fantastic free screening capabilities. With screeners, you can enhance your watchlists and narrow down on stocks with very specific characteristics.
- Finviz excels with its free Stock Screener, mainly on US stocks. The filter options are amazing, you can screen stocks by literally every available criteria (from detailed financial ratios, technical analysis patterns, etc…).

Pros: great screening capabilities. Most of the website and functionalities are totally free.
Cons: you can only analyze US stocks.
Stockcharts can also be a great option
Stockcharts.com is another hugely successful platform claiming 1.6m users, boasting award winning charting and analysis tools.
I’m sure you’ve seen their charts on dozens of websites, news articles, trading books or even seminars. They offer paid and free options.
Stockcharts has a number of very distinctive features, some of which stand out from other online websites:
- SharpCharts: a unique award-winning bar/candlestick charting program. The main reason people come to Stockcharts.
- PerfCharts: interactive charts that allow you to compare the performance of up to 10 different securities on a percentage variation basis;
- CandleGlance Groups: display up to 12 mini charts displayed side by side, great to get a quick overview of stocks that stand out;
- Seasonality: display a stock’s monthly price performance or trends over a specific time period;
- GalleryView: view charts on multiple time frames side by side, very useful for some trading strategies relying on simultaneous short, medium and long term analysis;
- MarketCarpets: Scan a wide group of stocks and detect trends and technical patterns;
- Relative Rotation Graphs: side by side display of the relative momentum and strength of a stock;
- Dynamic Yield Curve: an interactive chart showing the relationship between securities and interest rates.
Pros: a reference in the trading world and lots of unique features.
Cons: the interface is not quite as fluid as TradingView, sometimes looks a little old-school.
How do TradingView, Finviz or Stockcharts compare in popularity?
Here’s a real-time evolution of these three platform’s popularity
Cryptocurrency Analysis Tools
If you want to analyze the dynamics of Bitcoin or other altcoins, you can definitely use Tradingview , but there are more dedicated options, I have covered the top 3 Cryptocurrency and Bitcoin analysis tools.
- Coinigy.com
- Coinmarketcap.com
- Blockchain.info
So now that’s we’ve covered some great free charting tools, let’s move on to Step 7 and find some profitable Trading Strategies.